线粒体全基因组揭示嫩江流域史前人群遗传结构的动态变化
Ancient mitogenomes reveals Holocene human population history in the Nenjiang River valley
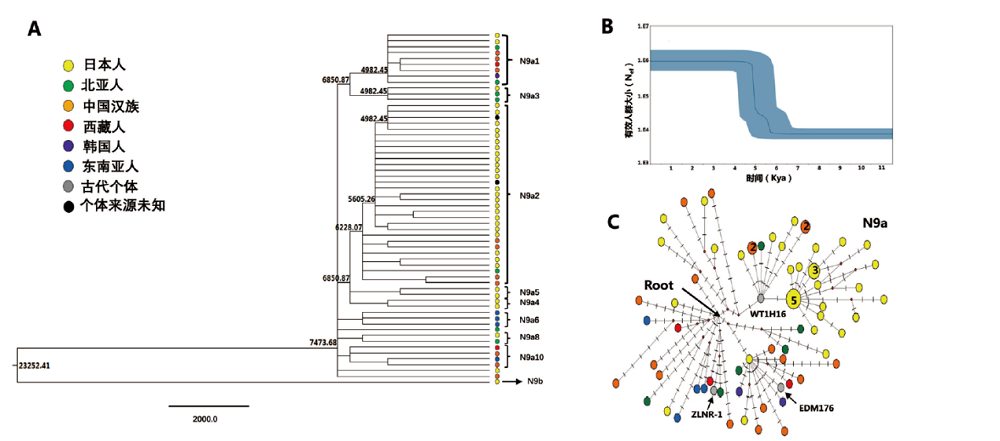
(A) 单倍群N9a序列的贝叶斯树,分支上的数字代表分支的分歧时间, 不同地理来源的个体应用不同的颜色表示,每个个体的Genbank 号见附
(A)The Bayesian tree for sequences from Haplogroup N9a. The long of line is the years before present, the number is the age for the divergence age for the clade, the individuals are colored according to different origin, the Genbank number for every individual was shown in Supplementary Fig S3. (B) The Bayesian Skyline plots of Haplogroup N9a showing the maternal effective population size history. (C)The Network of Haplogroup N9a. Haplotypes where the number of Shared individuals is greater than one are numbered